Industry and Economics
Robot Density by Country: The Full Ranking
Robots per 10,000 manufacturing employees, ranked. Korea leads at 1,220, the world average is 132, and China's rank of 22 hides the fact that it installs more robots than everyone else combined.
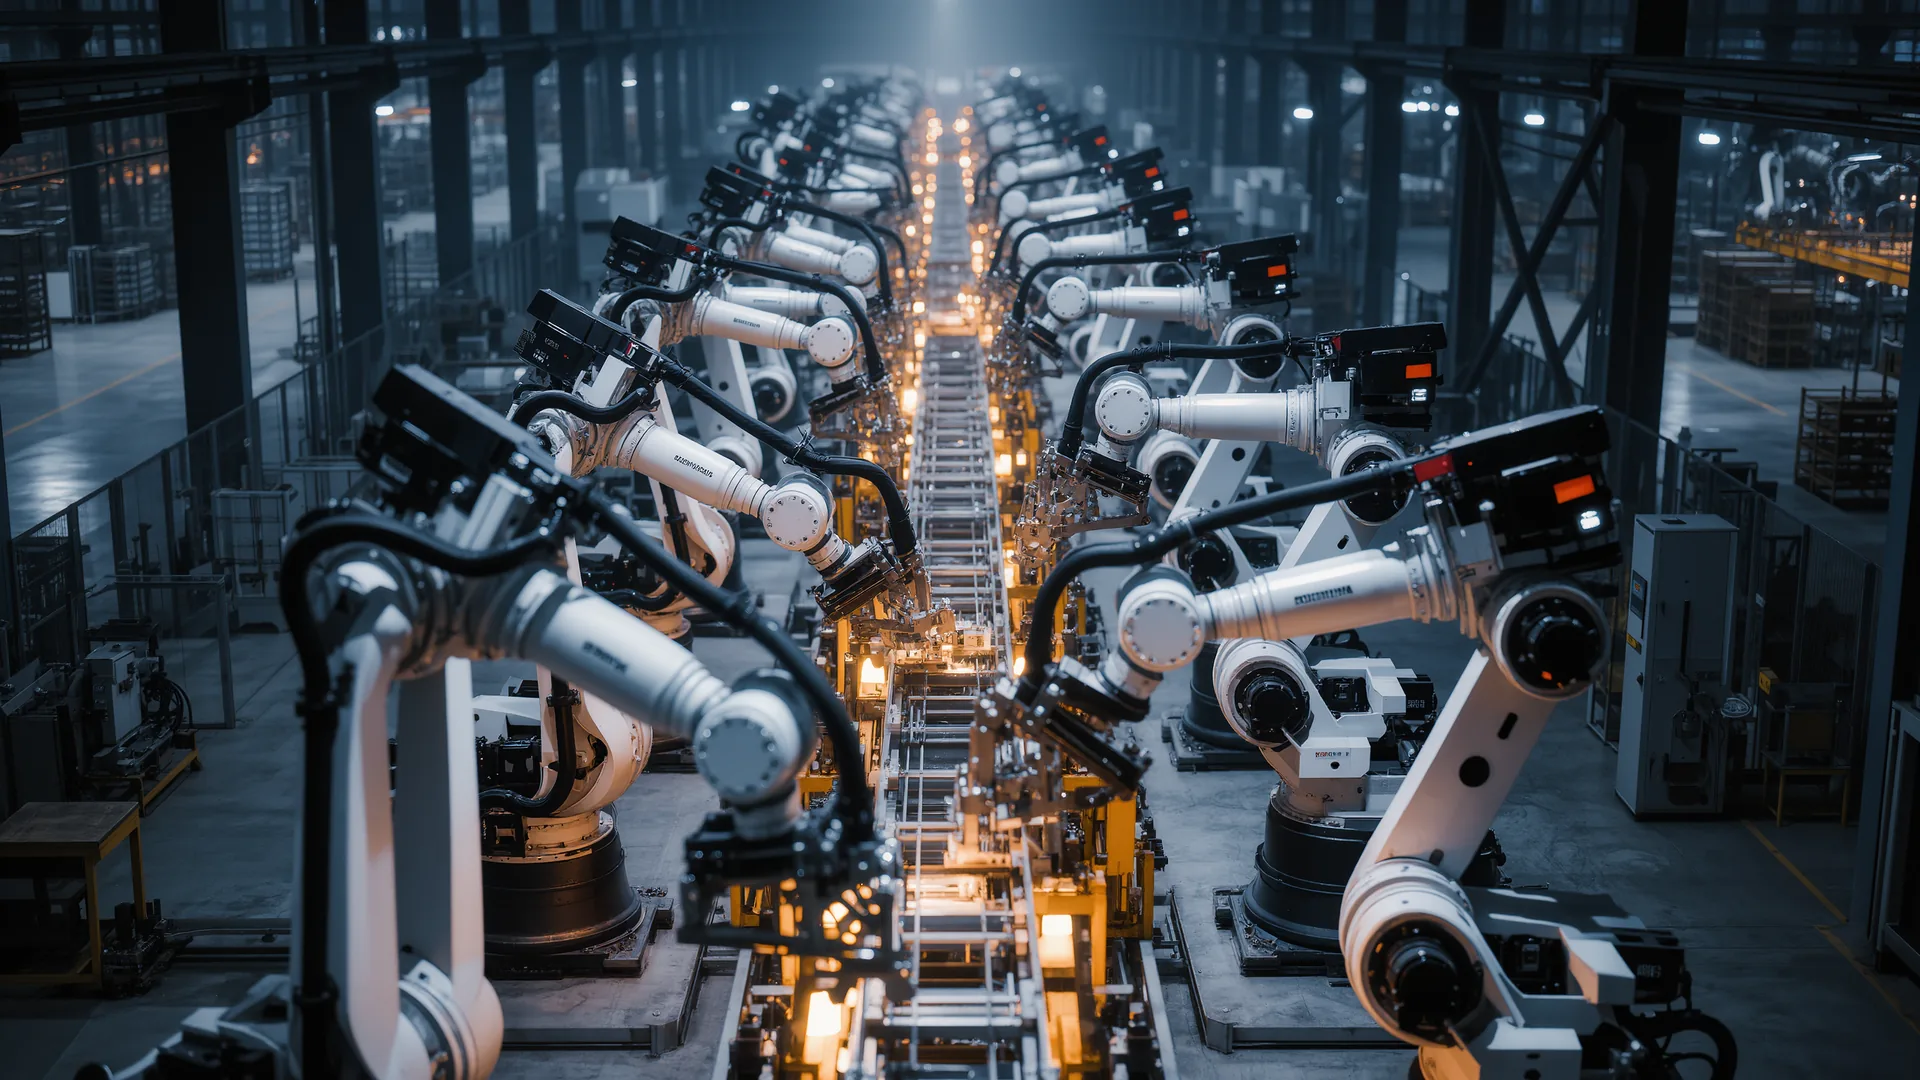
The Republic of Korea leads at 1,220 robots per 10,000 manufacturing employees, nearly ten times the world average of 132. Singapore is second at 818, Germany third at 449 and Japan fourth at 446. The figure that most confuses readers is China at 166, ranked 22nd, in the country that installed 295,000 robots in 2024, more than every other country combined.
The top ten
| Rank | Country or territory | Density | Annual growth since 2019 |
|---|---|---|---|
| 1 | Republic of Korea | 1,220 | +7 % |
| 2 | Singapore | 818 | +13 % |
| 3 | Germany | 449 | +5 % |
| 4 | Japan | 446 | +5 % |
| 5 | Sweden | 377 | |
| 6 | Denmark | 329 | |
| 7 | Slovenia | 315 | |
| 8 | United States | 307 | |
| 9 | Chinese Taipei | 302 | |
| 10 | Switzerland | 294 | |
| 12 | Canada | 241 | |
| 22 | China | 166 | +17 % year on year |
| Mexico | 62 |
Regional averages
| Region | Density | Year on year growth |
|---|---|---|
| Western Europe | 267 | +3 % |
| European Union, 27 states | 231 | |
| North America | 204 | +4 % |
| Asia | 131 | +11 % |
| World average | 132 |
What the ranking is good for
Density is widely quoted and frequently misused. It answers one question well and several others badly, and knowing which is which saves an argument.
| Question | Density answers it | Better measure |
|---|---|---|
| How automated is this country's manufacturing | Reasonably, with sector caveats | Density plus sector mix |
| Where should a robot maker sell | Poorly | Annual installations and growth |
| How large is the service opportunity | Poorly | Operational stock |
| Is manufacturing growing here | No | Output and employment separately |
| How competitive is this industry | No | Productivity and unit labour cost |
| Where is automation accelerating | Yes, through the growth rate | Density growth, not the level |
The last row is the underused one. The level tells you where a country has arrived; the growth rate tells you where it is going. Singapore's 13 % annual growth and China's 17 % year-on-year rise carry more information about the next five years than either country's current position does.
Sector mix explains most of the spread
Robot intensity varies enormously by industry. Automotive body shops run several hundred robots per plant, electronics assembly runs high volumes of small arms, and food processing, textiles and construction materials use comparatively few. A national figure is therefore a weighted average of very different industries.
- Automotive. The most robot-dense sector everywhere, and national shares confirm it: automotive accounted for 63 % of installations in Mexico, 47 % in Canada and 45 % in India in 2024.
- Electronics. The reason the Asian figures are high, with very large volumes of small arms in assembly and testing.
- Metal and machinery. The largest general industry category in most European markets.
- Food and beverage. Growing quickly from a low base, held back by washdown and hygiene requirements.
A country whose manufacturing is concentrated in the first two will always outrank one concentrated in the last two, whatever either does about automation policy.
Why China ranks 22nd while buying the most
China installed 295,000 industrial robots in 2024, about 54 % of the world total of 542,000, and its operational stock passed 2 million units. It nonetheless ranks 22nd on density, at 166 per 10,000, because its manufacturing workforce is enormous. The denominator is doing the work.
The trajectory is the interesting part. China's density rose 17 % year on year, the fastest movement of any major economy, and domestic manufacturers held 57 % of the Chinese market in 2024 against roughly 28 % as a decade average. A country that both installs the most robots and increasingly builds them itself is on a different path from one that simply buys them.
Why Korea is so far ahead
Korea's 1,220 is not a rounding artefact. Its manufacturing base is heavily concentrated in electronics and automotive, the two most robot-intensive sectors, and both are dominated by very large firms with the capital to automate. Singapore's 818 has a similar explanation with an additional twist: a small manufacturing workforce concentrated almost entirely in electronics makes the ratio structurally high.
The lesson for anyone comparing countries is that sector mix explains more of the variation than policy does. Comparing a country with a large electronics sector to one with a large food processing sector tells you about their industries rather than about their appetite for automation.
Frequently asked questions
Which country has the highest robot density?
The Republic of Korea, at 1,220 robots per 10,000 manufacturing employees in 2024, followed by Singapore at 818, Germany at 449 and Japan at 446.
What is the world average?
132 robots per 10,000 manufacturing employees. Western Europe averages 267, the EU-27 231, North America 204 and Asia 131.
Why is China only 22nd?
Because density is a ratio and China's manufacturing workforce is very large. It installed 295,000 robots in 2024, about 54 % of the world total, and still reaches only 166 per 10,000 employees.
Is rising density always a good sign?
Not necessarily. The ratio rises either when robots are installed or when manufacturing employment falls, and the figure does not distinguish between them. Check the workforce trend before drawing a conclusion.
Why do some small countries rank so high?
Sector mix. Economies concentrated in electronics and automotive, the most robot-intensive sectors, produce structurally high ratios, which is why Singapore at 818 sits above Germany and Japan.
Sources
- Robot density surges in Europe, Asia and the AmericasInternational Federation of Robotics, all density figures and growth rates quoted here
- World Robotics 2025, industrial robotsInternational Federation of Robotics, installation volumes and operational stock
- World Robotics report seriesInternational Federation of Robotics, methodology behind the density calculation