Safety and Standards
How Dangerous Are Industrial Robots? The Numbers
Robot-related fatalities are rare and concentrated: 61 deaths in the United States between 1992 and 2015, 78 percent of them in manufacturing, and most during maintenance rather than production.
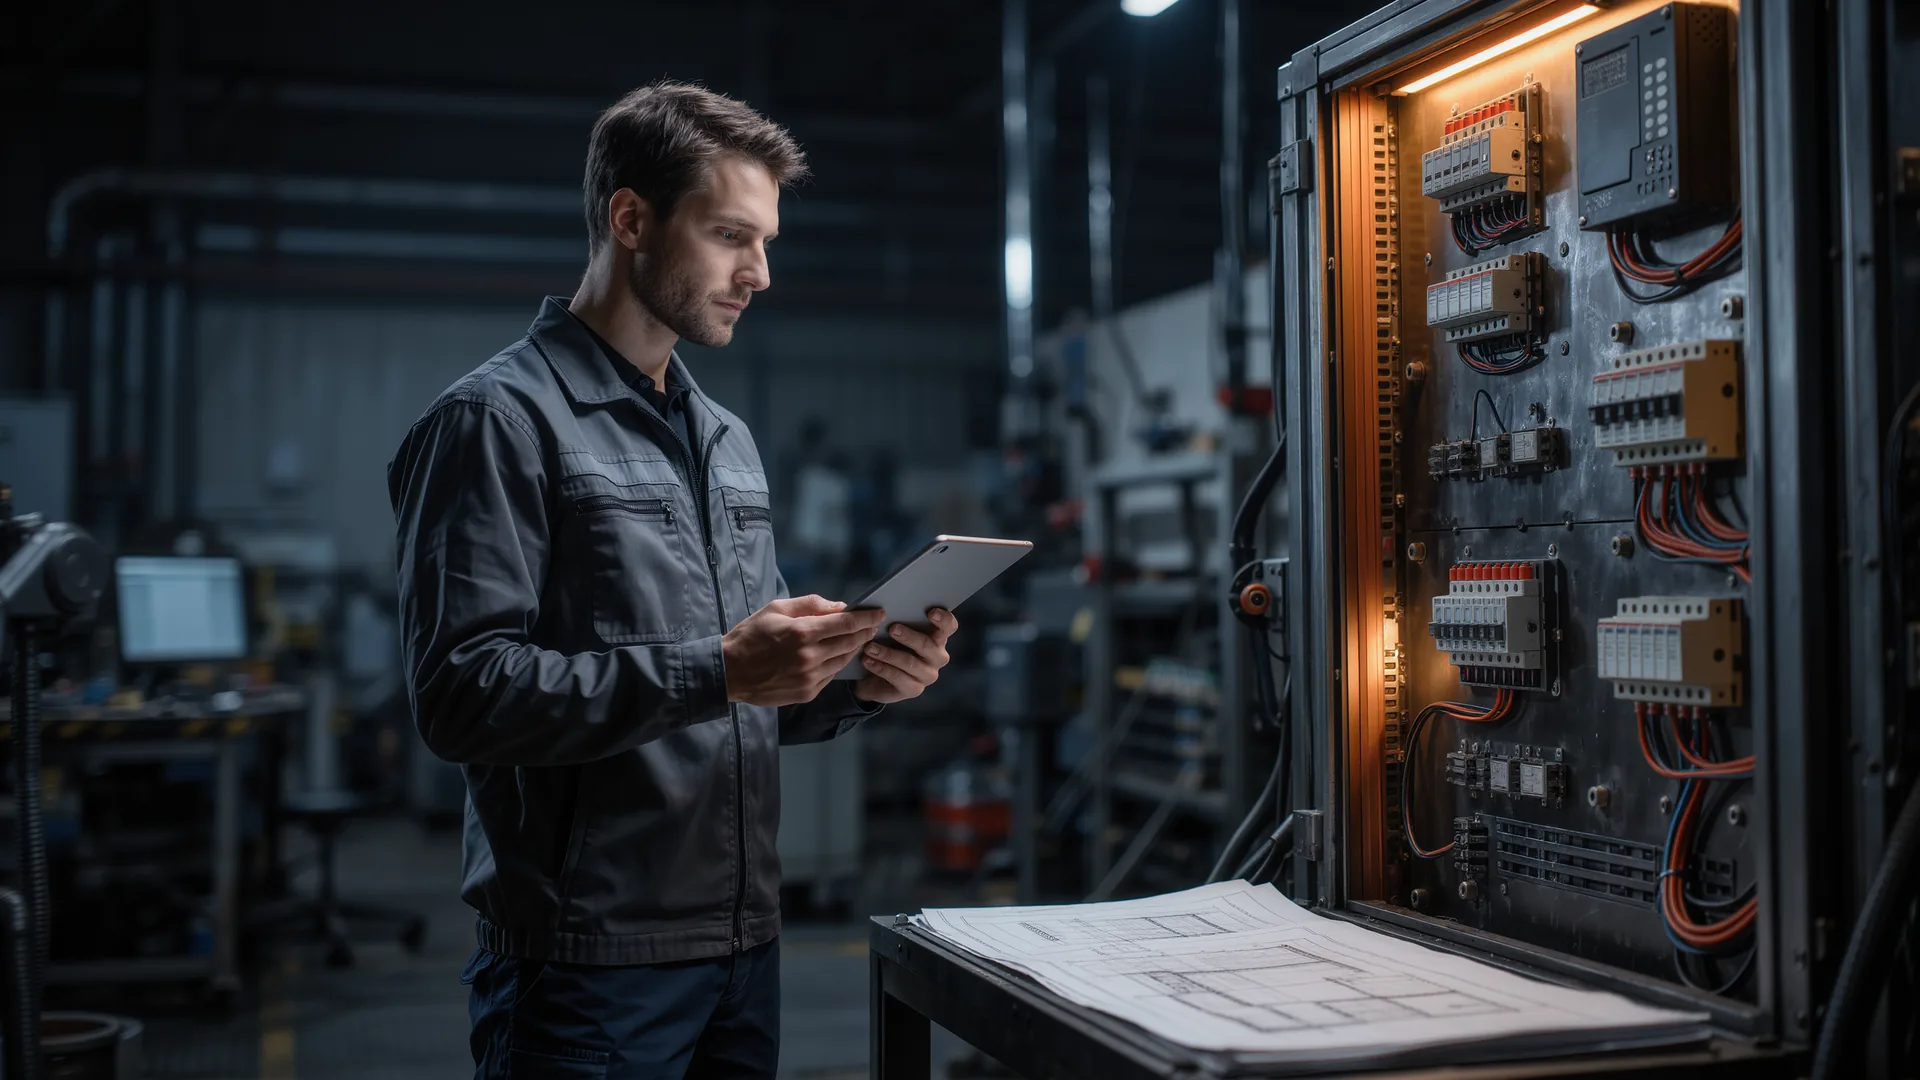
Rare, and concentrated in one situation. The US National Institute for Occupational Safety and Health recorded 61 robot-related deaths between 1992 and 2015, and 78 % of them occurred in manufacturing. A separate analysis of severe injury reports from 2015 to 2022 found 77 accidents involving stationary robots causing 66 injuries, mainly finger amputations and fractures. The pattern across all of it is consistent: the danger is intervention, not production.
The figures in context
| Source and period | Figure | Note |
|---|---|---|
| NIOSH, 1992 to 2015 | 61 deaths | Robot-related fatalities at work in the United States |
| Research analysis, 1992 to 2017 | 41 fatalities | Different inclusion criteria, illustrating definitional variance |
| OSHA records since 1984 | 43 accidents, 29 fatal | Keyword search of the incident database |
| OSHA severe injury reports, 2015 to 2022, stationary robots | 77 accidents, 66 injuries | Mainly finger amputations, head and torso fractures |
| OSHA severe injury reports, 2015 to 2022, mobile robots | 23 accidents, 27 injuries | Mainly leg and foot fractures |
| Manufacturing share of robot deaths | 78 % | Where the installed base is |
Set these against the installed base. The International Federation of Robotics counts 4,664,000 industrial robots in operation worldwide, with 542,000 installed in 2024 alone. Against that population, the fatality counts are very low, and low is not the same as zero.
The pattern that repeats
Across investigations, the same scenario appears far more often than any other: a person entered the operating space of a robot that was not in a safe state, usually to clear a jam, adjust a part, clean or perform maintenance.
- Intervention rather than production. Normal automatic operation with guarding intact is comparatively safe. The hazard concentrates in the moments the guarding is bypassed or the person is inside.
- Unexpected motion. A robot perceived as stopped resumed. A stationary machine is not thereby a safe machine, and a machine waiting for a signal is still live.
- Defeated interlocks. Doors held open, light curtains bridged, sensors taped, usually because the correct procedure was slow and the shortcut worked ninety-nine times.
- Injuries are severe when they happen. The reported injury profile of amputations and fractures reflects the energy involved rather than a high frequency of contact.
- Mobile robots injure differently. Leg and foot fractures dominate, consistent with crushing and running-over rather than with impact from an arm.
Reading incident data honestly
Anyone quoting these figures should know what they can and cannot support.
| Limitation | Effect on the figure |
|---|---|
| Definition of robot-related varies | Two sources report 61 and 41 for nearly the same period |
| Keyword searching of incident text | Misses cases where the word robot was not written |
| Severe injury reporting thresholds differ | Minor injuries largely invisible |
| National reporting systems are not aligned | Cross-country comparison is unsound |
| Denominator rarely stated | Counts without an installed base say little about rate |
| Near misses not collected | The most useful preventive data does not exist |
The last row matters most for anyone running a plant. Fatality statistics describe outcomes that are already too late; a site that records near misses on its own cells learns which procedure is being shortcut long before the numbers above become relevant to it.
What actually reduces the risk
| Measure | Addresses | Effort |
|---|---|---|
| Design jam clearing so entry is unnecessary | The dominant scenario | high, at design time |
| Safe stop with position hold for entry | Unexpected restart | medium |
| Interlocks that cannot be defeated with tools to hand | Bypassing | low |
| Presence detection inside the cell | Person left behind on restart | medium |
| Restart requiring deliberate acknowledgement from outside | Restart with someone inside | low |
| Making the correct procedure the fastest one | The reason shortcuts exist | medium |
| Training that covers intervention as well as operation | The task where people are hurt | low |
The last row of that table is the one worth arguing for internally. Operator training almost always covers running the cell and rarely covers clearing a jam safely, which is precisely inverted relative to where the harm occurs.
Frequently asked questions
How many people are killed by industrial robots?
NIOSH recorded 61 robot-related deaths in the United States between 1992 and 2015, 78 % of them in manufacturing. Other analyses covering similar periods report lower counts because of different inclusion criteria.
What injuries do robots cause?
Analysis of US severe injury reports from 2015 to 2022 found stationary robots caused mainly finger amputations and head and torso fractures, while mobile robots caused mainly leg and foot fractures.
When do robot accidents happen?
Overwhelmingly during intervention rather than production: clearing jams, adjusting parts, cleaning and maintenance, when a person is inside the operating space and the robot is not in a verified safe state.
Are robots getting safer?
The installed base has grown far faster than incident counts, with 4,664,000 robots in operation worldwide, so the rate per robot has fallen substantially. The reporting is too inconsistent to state a precise trend.
What single measure helps most?
Designing the cell so that jam clearing does not require entry. Every other measure manages a situation that this one removes, and it is also the measure that has to be decided at design time rather than added later.
Sources
- Robot-related fatalities at work in the United States, 1992 to 2015National Institute for Occupational Safety and Health (NIOSH)
- Robot-related injuries in the workplace: an analysis of OSHA severe injury reportsPeer-reviewed analysis of US severe injury reports, 2015 to 2022
- Robotics, hazard evaluation and solutionsOccupational Safety and Health Administration, incident patterns and control measures
- World Robotics 2025, industrial robotsInternational Federation of Robotics, installed base used for context